.
CET Talks: Accreditation, Learning and Leadership
Episode 02
JUNE 20 2023 . 24 MINUTES
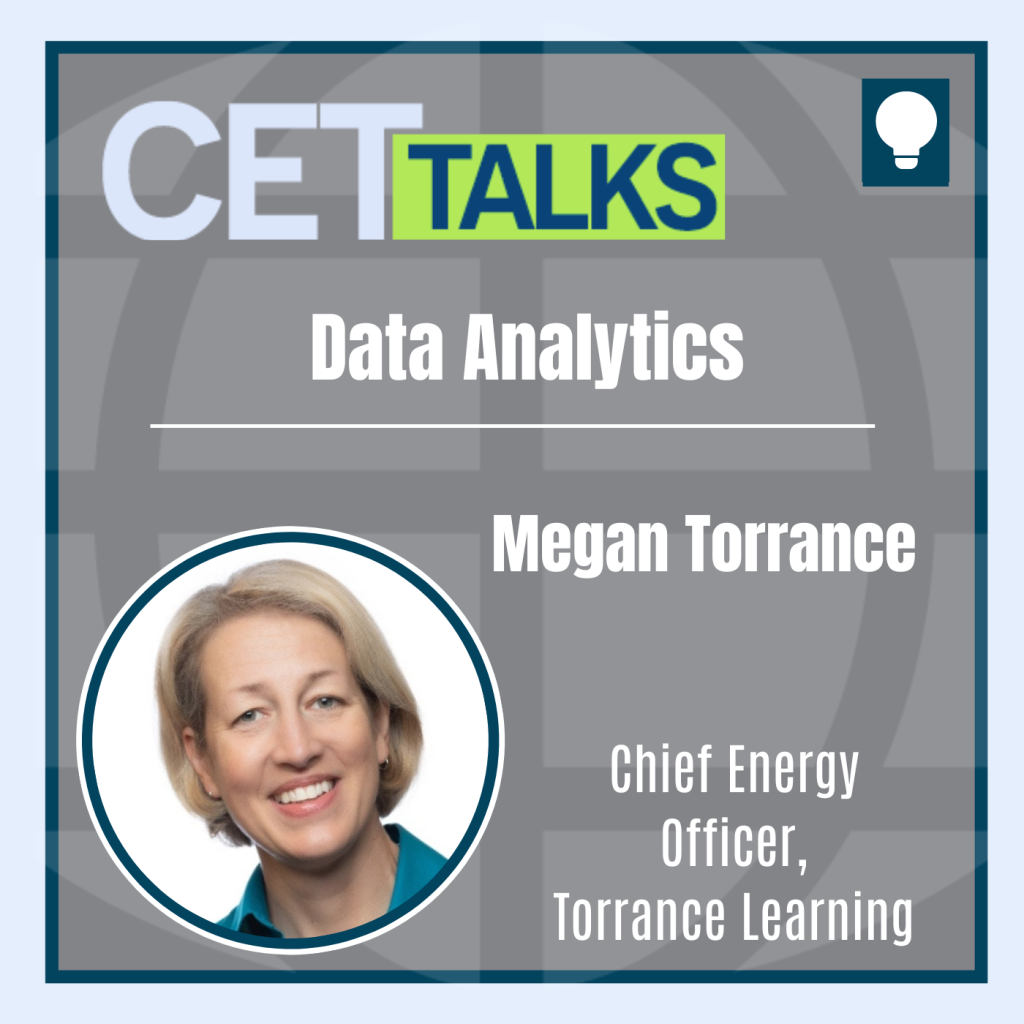
Data Analytics for Instructional Designers
Randy Bowman, Interim President and CEO of IACET, and co-host and certified corporate wellness specialist, Mike Veny, sit down with Megan Torrance, as Megan shares insights from her newest book, Data & Analytics for Instructional Designers, released in April 2023. Megan provides an overview of data analytics and learning analytics, as well as the difference between measurements and metrics. Discover what data learning programs should be collecting and how they should benchmark those metrics.
Listen to the Podcast
Welcome to CET Talks, the International Accreditors for Continuing Education and Training’s podcast, where we convene thought leaders in the continuing education and training ecosystem to share ideas, research, best practices, and experiences that promote the creation of a world that learns better. Your hosts are Randy Bowman, Interim President and CEO of IACET, and certified corporate wellness specialist Mike Veny.
Randy Bowman, Interim President and CEO of IACET, and co-host and certified corporate wellness specialist, Mike Veny, sit down with Megan Torrance, as Megan shares insights from her newest book, Data & Analytics for Instructional Designers, releasedin April 2023. Megan provides an overview of data analytics and learning analytics, as well as the difference between measurements and metrics. Discover what data learning programs should be collecting and how they should benchmark those metrics.

Transcription
Host: Welcome to CET Talks, the International Accreditors for Continuing Education and Training’s podcast, where we convene thought leaders in the continue education and training ecosystem to share ideas, research best practices, and experiences that promote the creation of a world that learns better. Enjoy the episode.
Randy Bowman: Hi. Welcome to the CET Talks, the International Creditors for Continuing Education and Training’s podcast, where we convene thought leaders in the continuing education training ecosystem to share ideas, research best practices, and experience that promote the creation of a world that learns better. My name is Randy Bowman, and I’m your IACET Staff host.
Mike Veny: And I am the CET Co-host, Mike Veny. I’m a certified corporate wellness specialist and the owner of Mike Veny, Inc., an IACET-accredited provider. Hi, Randy. How are you doing?
Randy Bowman: Good. Good to see you.
Mike Veny: It’s good to see you, too. I just want to ask you, how do you think our podcast is doing?
Randy Bowman: I don’t know. I’ve got to look at the metrics first, and we have to see what the data says.
Mike Veny: Oh, so it’s not just based on feeling that’s the right answer. That allows me to introduce our guest, someone who I’m really excited to interview today. We have Megan Torrance in the house, and I want to just tell you a little bit about Megan. First of all, I learned about Megan about two weeks ago while listening to a podcast. I’m checking out this podcast on data and analytics. Then next thing I know, I got this email that I’m going to be interviewing her. It’s been a nice few weeks of learning about data and analytics. Megan is the CEO and founder of Torrance Learning, which helps organizations connect learning strategy to design development data, and ultimately performance. She has 25 plus years’ experience in learning, design, deployment, and consulting. She teaches and shares techniques for agile project management, for instructional designers, and is the author of Agile for Instructional Designers: A quick guide to LLAMA. She’s a frequent speaker at major conferences nationwide, a graduate of Cornell University with a degree in communications, an MBA, and a new book called Data Analytics for Instructional Designers, which I think both Randy and I purchased a copy of. So, welcome to the show, Megan.
Megan Torrance: Thank you. And thank you for buying copies of the book.
Mike Veny: Before we get started into the real nitty gritty of the book, I want to ask you, when we talk about this term, data analytics and learning analytics, what are we talking about here?
Megan Torrance: We’re talking about exactly what you two opened with. It’s not just about feeling, how are we doing? I don’t know. The podcast sounds great. Feels good. We’re having a good time, and a couple people told us it’s awesome. It’s really around how do I collect data, talk about what that is. How do I make meaningful patterns, insights, find trends, and use that for decision making? There’s a bunch of techniques and tools that you can use. We need to get everything from data capture, data storage, data cleaning, and then be able to draw inferences and insights from that in order to take action or make decisions. Learning analytics, then, is a subset of data analytics. We’re looking at things related to, not surprisingly, learning and the learning experience. It’s the learning environment and how that’s performing, and the learner and learner analytics, as well. So there’s lots of different dimensions that we can be looking in there, that all fall into that learning analytics bucket.
Mike Veny: I said to you before that I had the honor of listening to you a few weeks ago on another podcast, and I actually listened to the episode twice. One of the things I learned from this episode was that learning organizations are sometimes weak in this area of data and learning analytics. Can you share more about that? About what ways they’re weak and maybe why?
Megan Torrance: Yeah. It’s interesting, and this is a broad generalization that is not true for every organization and every individual. Many times when I talk to folks in the learning space, they are not math folks. They’re not the quant jocks. They weren’t chewing up statistics and asking for more. There’s a couple of reasons, right? One is just the nature of the work we do. We tend to be instruction and verbal types, and media types, and that kind of thing. There’s also a certain amount of learned helplessness. That’s not meant as an indictment, but it’s an environmental factor. So, we have SCORM, and we have learning management systems, which are the core of just about everybody’s learning ecosystem. SCORM is fantastic. It is global. It is interoperable. It allows organizations to change out vendors, software, and people, and platforms. It all just works. It’s like you can go, right? SCORM is like USB. You can go to the grocery store or a gas station or Best Buy or Amazon and buy a USB plug that works in everything that you have a USB for. There’s a couple different variations of USB, but they’re relatively straightforward and you can make it work. That’s fantastic. It’s been fantastic for our industry. The problem is that SCORM, for its time, in order to get that amount of interoperability, it doesn’t have a lot of richness or depth. It’s a pretty shallow vocabulary. I like to think of it like those kids games where their characters hop along, and they can talk to each other, but before you’re a certain age, your character has a certain short vocabulary that it’s allowed to say, “Hi, I like animals, I like this.” Then they hop along, and they move somewhere else. For those folks who are listening with the video, you just got a really interesting visual there; I’m hopping around my screen. Sorry, folks on the audio only. So, that allows them to interoperate with each other in a safe space because it’s a limited vocabulary. All sorts of interesting, or otherwise, things happen when you’re not limited in your vocabulary. One of the things in that limited vocabulary of SCORM, though, is that we don’t have a lot of data. We don’t have a lot of data that means a lot. We can count completions in dates and hours. The old adage about the learners weight—I can weigh them before and after and see if they gained knowledge— kind of thing. There’s only so much we can do with it. There’s only so much we do with it. We don’t build the skills to do much with data because we don’t have much data to do with it. Over time we tend to create a focus on the instruction and the words and the pictures and the movement and the interaction and less the data coming out of it.
Randy Bowman: I love that you talked about the vocabulary. It’s so important in data to define each and every thing and have really clear definitions. So, one of the things I really liked in your book, that just stood out to me, is you see a difference between measurements and metrics. Can you explain to our audience listening what the difference is between them, because I think we use those interchangeably, and I’m not quite sure we should.
Megan Torrance: Randy, it’s interesting. So on a practical perspective, there might be 60 different answers to that question. Then, on a practical perspective, what matters is that you and I are talking about the same thing, regardless of what we talk about. Generally, I think of measurement as the process of measuring; I am getting that raw data. I am right? My toddler is 24 inches tall; I’ve measured it. There’s a culture of measuring where parents of small children measure them constantly. Every time you show up to the doctor, they measure those kids. So, there’s both the act and the process of measuring; there’s a culture of measuring and documenting and reporting on that. But if it’s been a long time since I had a kid, or I don’t know how big 24 inches is, I don’t know if my kid is big or little. It’s just a thing; it’s measurement, it’s 24 inches. Metric centered, when we are evaluating those measures, and they’re often calculated, they’re often benchmarked, they provide us an opportunity to connect one with another. So for example, with kids. With small children, we have percentiles. Is my kid in the 90th percentile or the fifth percentile? How is that relative to their weight? Are they on track, off track? Is the trend relevant? That, then, becomes a metric that is meaningful, that you can take action on. Both of them are valuable. Sometimes metrics become weighted endangered. Oh, I’m going to take this into an interesting rabbit hole. Okay? Then we have fracture site, right? Like BMI body mass index, which is a calculated based on your height and your weight and has a value judgment. You get a BMI, a certain size, we start calling you names. That may or may not impact actual health, but we’ve built this around it. And it turns out the BMI calculation and those ranges are based on white college-aged men when they originally developed that metric. So, it’s a metric that’s skewed; used to apply to a larger population. It was designed for this— fascinating stuff here. So, there’s value, but then also biases built into some of these things. We could go hunt for… how much time do we have?
Randy Bowman: Never enough. Never enough. So, those are great. Those are some great examples from health and life and parenthood. What about my learning program? What data should I be collecting for my learning program? What should I be measuring?
Megan Torrance: There’s a lot of things. There’s a lot of things a lot of us are used to. I just had a fantastic conversation with Will Thalheimer—if you haven’t had him on your podcast, you absolutely should. He’s fantastic. One of the things that we talked about was, what should we evaluate when it comes to learning? A lot of us in our industry use the Kirkpatrick levels; you had the fifth, and you have ROI, and so we’re measuring immediate post course. Did you like it? Did we meet the objectives? Did the instructor seem smart? Was the coffee good? Do you feel ready to apply this? Useful stuff. Generally, not sufficient. There’s lots of stories in which we have that, that is interesting, perhaps useful, but not sufficient. We can measure your knowledge. We can measure whether or not you do the thing on the job, and whether or not it makes any difference, and whether that was a cost effective way of doing it. That’s your Kirkpatrick plus, your ROI. Will Thalheimer’s learning transfer evaluation model then blows that out to a lot more depth, where even before we start talking about perceptions, it’s who showed up? Who did we reach when we marketed the learning experience, when did they show up? Under what circumstance? What was that activity? There’s that attendance and then that activity. What did they do in there? Were they active? Were they passive? Did they try all the things? Not just, we released a course to a bunch of—it’s a physician course, right? We had these cases, here’s the situation, what would you do when the learner enters their thing? There’s somebody who just went a, a, a, a, a, a, a, a, a, a on the keyboard and hit ‘Submit.’ We know that. Now we have that, and we can say, “Does that improve? Does that have any impact on this learner’s results?” That’s useful, interesting information. I can do that. I can also then be looking—a lot of times when we start a program, yes, we care that people learn, but in workplace learning, we’re interested in whether or not they can transfer that on the job. Workplaces are not for learning; workplaces are for organizing work and getting that done. That’s really the measure. When we’re starting a learning design program, we should be asking those sponsors, how do you measure the work being done? All of the learning metrics are really precursors to the work metrics.
Mike Veny: I love this because it’s weaving in the marketing metrics with the management metrics. It’s all one ecosystem basically, is what you’re saying.
Megan Torrance: Yes. And here’s the thing, Mike. Marketing and management; when we talk about functions in an organization that use data, we talked, it’s not the learning function, right? Historically; and we’re catching up, we’re getting there. It’s pretty fun to watch. But it’s marketing and management; they get metrics, they get data budget. Just saying; putting that out there into the world.
Mike Veny: I heard a rumor, I don’t know if this is true, that in your spare time you play ice hockey, and you are a goaltender. How does data and analytics play into your role as an athlete?
Megan Torrance: You haven’t seen me play, have you, Mike?
Mike Veny: No, I have not seen you. No.
Megan Torrance: It’s a very slow experience, but it’s—here’s a fantastic thing. Think about the NHL, even college hockey. A goaltender has fantastic metrics. Somebody’s job is to keep track of all of those: shots on net, actual goals, saves percentage, the whole nine. All of that can be used. And you can get more granular: shots from the left side and the right side and the point and the slot and right. All of that penalty play; the whole thing. I play adult rec league hockey at 11:30 at night. No one is watching our games. No one is taking anybody to watch. So, the amount of stats we get, it’s like SCORM. We know scores and penalties, and as the goaltender, I don’t score; I sure as heck better not be getting penalties. So, I don’t have great data on my own game, other than you two were talking, the end of the night. Do I feel good about how I performed or not? Which is of limited use, but personally valuable.
Randy Bowman: You keep mentioning SCORM. Just for our listeners who may not be familiar with that as an acronym, can you tell us a little bit about that? Then you mentioned it’s lacking in some standards for learning data. Are there any standards for learning data that exist?
Megan Torrance: Yeah. SCORM stands for Shareable Content Object Reference Model, which you will never need to know again. But that is a turn of the century, circa 2000, 2002, data standard for learning. That is, in the corporate, in the adult market, it is global. Every LMS and every e-learning course on the planet, every government, military, corporation, large or small can use SCORM; the LMSs that support that market, all support SCORM. As we talked, it’s got limited vocabulary. XAPI has actually recently achieved standard status from IEEE. It’s been a specification for 10 years, developed by the same folks who developed SCORM and XAPI, with its sub spec of CMI five. So CMI five handles all the SCORM stuff, the launching from an LMS and how that works. XAPI is the broader conversation around, ‘we can talk about anything’ and XAPI has now achieved standard status, which hopefully provides the robustness that the industry needs to say, “Okay, it’s a thing now.” It’s been a thing for a while. A lot more organizations, a lot more software companies, both platforms and authoring tools, support XAPI than ever before. The community is really strong around that, as well. More and more software companies are coming to me, including startups, like, “Hi, we want to do this.” How do we do this so that our data is all in that same flow with all the other systems?
Randy Bowman: Cool. So, XAPI has the data that we need.
Megan Torrance: So, XAPI, right? X stands for experience and then API. The application programming interface is the agreement of two computer systems and how they’re going to talk to each other and share data. X then allows me to share data about learning and performance experiences and take all of that and analyze that, move it around. It’s just like SCORM; it’s designed to be interoperable. It’s just got a much richer vocabulary. It’s a grammar, not a vocabulary. As long as I follow the grammar, I can say anything I want. I can have these glorious runoff sentences with all sorts of metadata, and sub tags, and all sorts of goodness in there. That data is also portable. In fact, it’s even more portable than SCORM is. So SCORM, you launch a course, send us data back to the SCORM, and it hangs out in the LMS. XAPI, because of its portability, allows you to more easily move from one data store to another and perform transmogrification on those. So, I want to take these 10 statements. When I get all of these 10, I want to trigger the creation of a new statement that’s a summary that goes to this other place. You can do that with XAPI; you really can’t do that with SCORM. I’m watching Mike go, “Hmmm.” So, it’s pretty cool stuff. I get very whipped up about this.
Mike Veny: Wow, we are all about a world that learns better. I want to ask you, what does a world that learns better look like to you?
Megan Torrance: When I think about a world that learns better, I think about a world in which we’re using data to know what works. If it works, how does it work? Under what circumstances does it work? Then delivering what works to learners and finding out if it worked for them and using that as a self-reinforcing system. That can be quantitative data. We spent a lot of time talking about, we can’t ignore qualitative data and how it works for them, not just in the bits and bytes, but as humans. And that’s important. I see it and I want proof, not just gut feeling around, “Hey, Maha, this hockey game was better than last week.” Or, “Hey, this podcast was better than last week’s.” But to have the data to be able to back that up. When we’re able to do that, I think we’re able better to support learners, to support each other as professionals, and to support the industry and the credibility and the value that we bring to our organizations. As we’re able to do that, our organizations learn about the value that we have. We spend less time proving our value and more time doing the things that work.
Mike Veny: I love that. Well, Megan, thank you very much for this powerful interview; so much I got out of it. Randy, I was going to tell you my takeaway from it, and then I want to hear yours. I know for me, one of my takeaways is that I really need to take a hard look at the data and analytics from my organization from an overall perspective and come up with a whole strategy around that, how it’s all going to be interwoven together. And maybe consider joining an ice hockey league. That sounds fun. So what about you, Randy?
Randy Bowman: What I’m taking away is I learned SCORM 20 years ago when I was first getting into development, and I did not even know this whole XAPI existed. I’m excited to just get a little glimpse of that today and to start researching, going deep in there, and learning more about XAPI and how it can help transform our learning management systems. Megan, thank you so much for being here. We loved having you and hope that we can get you again and can continue this conversation. Listeners, if you have not checked out her book yet, Data and Analytics for Instructional Designers, I highly recommend it to you. It’s a great read, and it packs so much more than we can do in just a half hour. Definitely go out and find that. As we do head out, I do want to ask our listeners, how are you using or how do you plan to use analytics in your own learning development program? Would love to have you find us on LinkedIn or at Twitter and share your ideas, be part of the conversation. You can find Megan’s books on Amazon and her website, torrancelearning.com.
Mike Veny: And don’t forget, you can submit topic ideas, suggestions for guests, and other feedback on the CET Talks podcast page of the IACET.org website. We certainly hope you’ll subscribe to this podcast, so we can have more analytics to look at on your favorite podcast listening platform, and so you don’t miss any episodes. Thank you so much for joining us today.
Host: You’ve been listening to CET Talks, the official podcast of IACET. Don’t forget to subscribe to the podcast on Spotify, Apple podcast, or wherever you listen to podcast. To learn more about IACET visit IACET.org. That’s I-A-C-E-T.org. Thanks for listening, and we’ll be back soon with a new episode.
Episode 31: Training Tomorrow’s Talent: Exploring Certification, Standards, and Impact with ATD’s Certification Institute
Episode 30: Silos to Synergy: Holistic Approaches to Creating Collaborative Learning

Episode 29: Credentials in Crisis: Challenges and Opportunities in Modern Education Recognition
Episode 28: Accreditation Uncovered: Essential Insights from an Industry Leader
Episode 27: Two Truths with a Lie: Managing the Myths of Modern-Day Learning

Episode 26: From Bending to Blending: Best Practices in Integrating Externally-Created Content

Episode 25: From Insight to Action: Charting the Career Path of a SME-turned-ISD

Episode 24: Cultivating Careers: The Power of Employee Engagement for Organizational Success

Episode 23: Igniting Imagination: Crafting Creativity in Training Environments
Episode 22: The Metrics of Change: Navigating Purposeful Measurement in L&D
Episode 21: Pathways to Success: The Value of Lifelong Learning through Digital Credentials
Episode 20: Outcomes to Achievement: Crafting Tomorrow’s Workforce Through Competency Models
Episode 19: Chatting with the Future: Enhancing AI Output Through Prompt Engineering
Episode 18: On the Inclusive Frontier: Harnessing Neurodivergence in Modern Training

Episode 17: Designing with Purpose: Strategies for Accessible e-Learning Development

Episode 16: Innovating Education: Navigating Accreditation for Short-Term Training
Episode 15: Beyond the Basics: Elevating Virtual Training through Expert Facilitation
